What are support and resistance
So, let’s talk about support and resistance.
The first thing I want to explain to you is, what I call…
The Undershoot
It’s a term that I came up with, so if it sounds weird to you, don’t worry, I’m going to explain to you what the undershoot is about.
Basically, you see price rally, then it retraces back towards support and tested three times: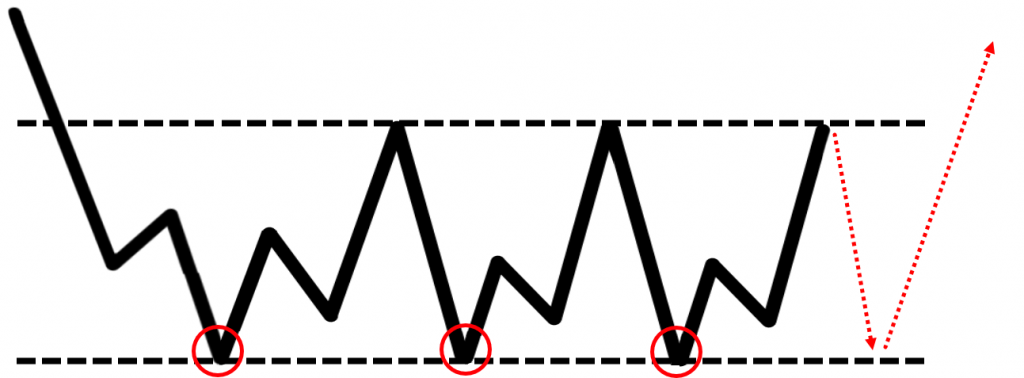
Now, you know there’s support over here!
When the fourth touch comes back, you are in anticipation that the support will hold!
What you do is, you place a buy limit order at support.
The funny thing is…
The price undershoots.
It did not trade to the support level that you want to get long and then traded higher once again: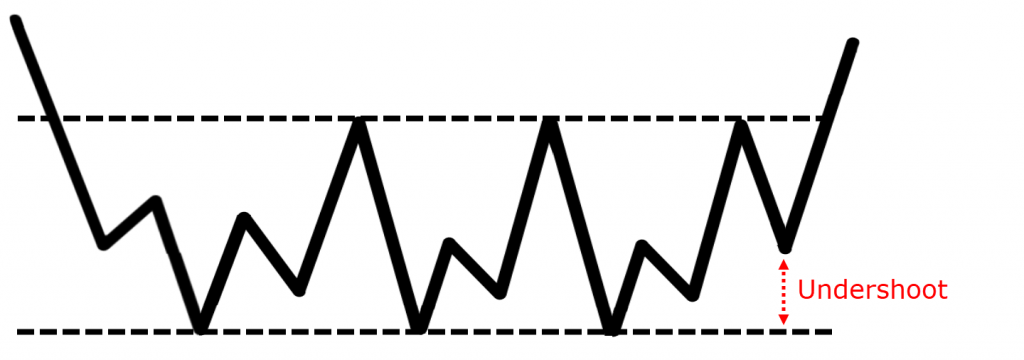
Thereby causing you to miss the trade because it undershoots the support.
Now, another example is what I call…
The Overshoot
So again, similarly price rallies higher and retraces.
And then, you notice that there is a support level…
What happens is that you place your buy limit at support hoping to get filled:
And then what happens is that it overshoots your support, and then it trades higher.
So, in this scenario, you got long, and you’ve got stopped out at the same time: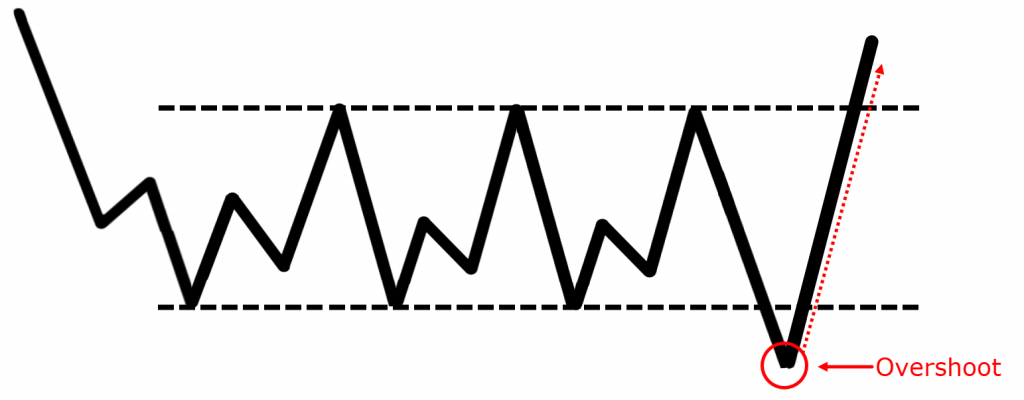
Are you with me?
So, what is my message to you?
My message is actually very simple, support and resistance are an area on the chart it is not a line on a chart.
An area… This is the keyword.
When you look at support and resistance and treat it as a zone where price could potentially bounce before it reaches the exact level you are highlighting out.
Or it could exceed the level that you are looking at, and then reverses from there.
To make things simple, what I want you to look at is to treat it as an area where the price could come close to support.
But not very deep into the support area that you have highlighted.
Or it could exceed the area you have highlighted, and then reverse from there.
Here are a few examples to show you:
I would draw it as an area on the chart.
I use two lines to illustrate an area, rather than one line.
If the price were to retrace, at this point in time I should alert myself that there is a possibility of price really retracing higher!
You want to be alert, you want to give yourself some buffer for this.
Another example, support is an area on a chart:
Notice, I’ve used it as an area.
You don’t want to just put one line on your chart.
Because if you are just focusing on one line.
Chances are you will experience the two problems I shared with you earlier.
Either price undershoots, or overshoot.Okay?
Moving on…
Number of re-tests
I’m sure you’ve heard in books or other people telling you that the number of times support and resistance gets tested…
The stronger it becomes.
But, let’s think about this, does this make sense?
First, let’s understand why support and resistance holds.
Well, they hold simply because there is possibly an order in a market.
For example, in the area of support, there are buyers willing to bid up prices.
Every time price comes towards the area of support, they want to buy in that area!
Because they think it’s an area of value!
But what happens when the order runs out?
So, let me walk you through a hypothetical example.
Say, there is an area of support, and I have a very big fund.
I want to buy 100 million dollars’ worth of stocks, or currencies, whatever, it doesn’t matter.
100 million worth of stocks, currencies, bonds, whatever.
Each time price comes lower, I managed to get filled 30 million over here: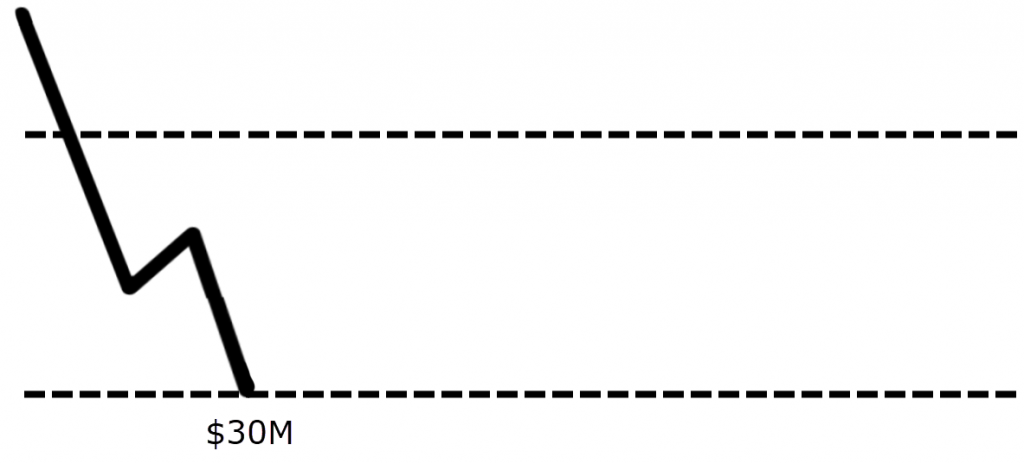
And then I cannot get filled anymore before price retraces higher!
And, it comes back down, I buy another 30 million: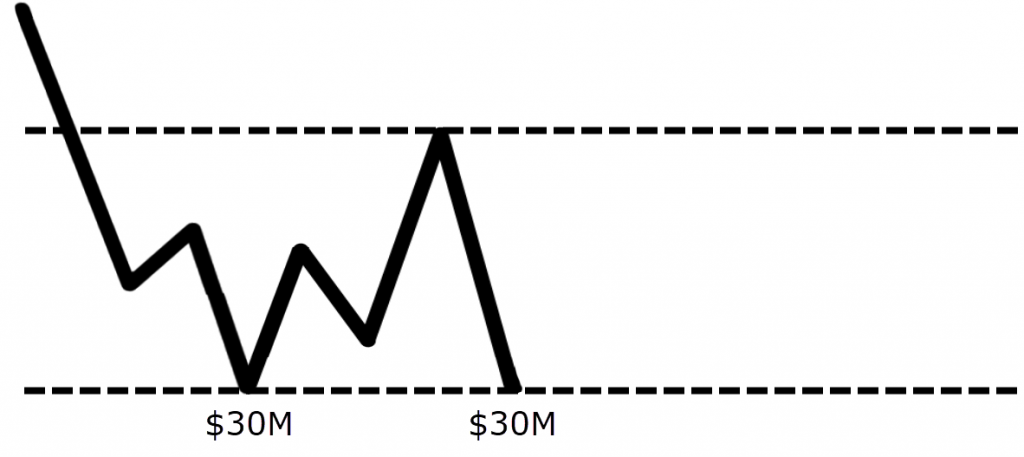
Then it trades higher, come back down I buy another 30 million: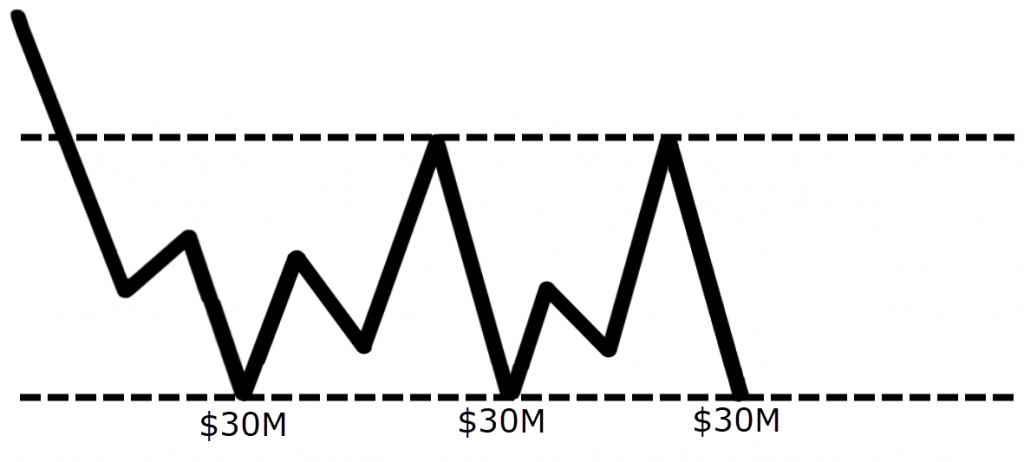
And it trades higher, and it comes back down. I buy the remaining 10 million: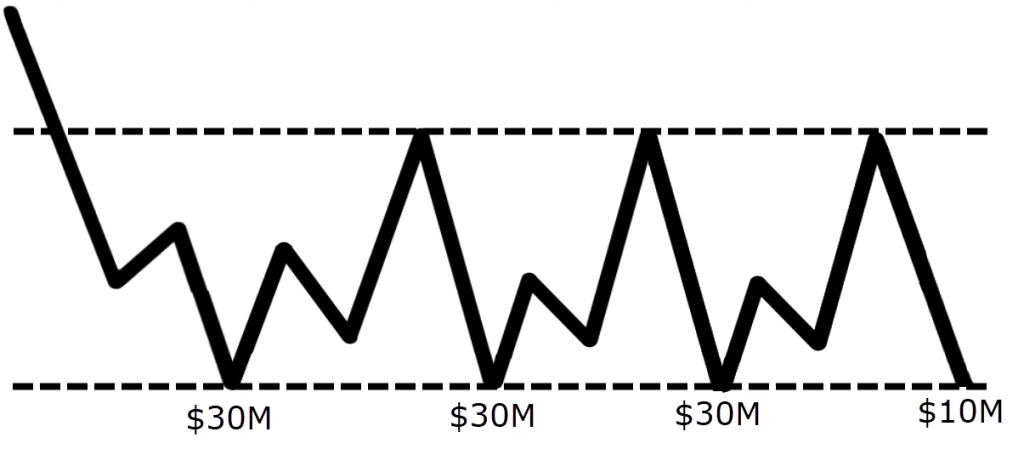
Now, I basically have been filled out my entire order of 100 million orders of stock, shares, or whatever they want to fill!
And right now, there is no one supporting the market anymore…
So, if these entire orders are filled at support.
There are no more orders willing to buy in this area of support!
What will happen to this area of support, if there is no more buying pressure down here?
You can see clearly the support has tested four times, and there is no more buying pressure…
The logical sense will be that the support will break!
Am I right?
Because there are no more orders down here to fuel the buying pressure!
When you see a chart, and support or resistance has been tested many times, you want to be careful of it.
Because there is a good chance that it will break.
Because of the buying or selling pressure has basically been used up.
The orders in the market have been filled, so be aware of this.
The message that I want to put across is…
The more times it tests the support and resistance, the weaker it becomes.
This is my message for you, this is a key takeaway.
Stop loss placement
For example, you have a range market, price trades higher and lower, and then trades to the middle:
And, you want to short this market…
You notice there is a resistance, so the price trades higher, and you go short.
Where would you put your stop loss?
Well, logically speaking, you will put your stop loss above the highs, over here: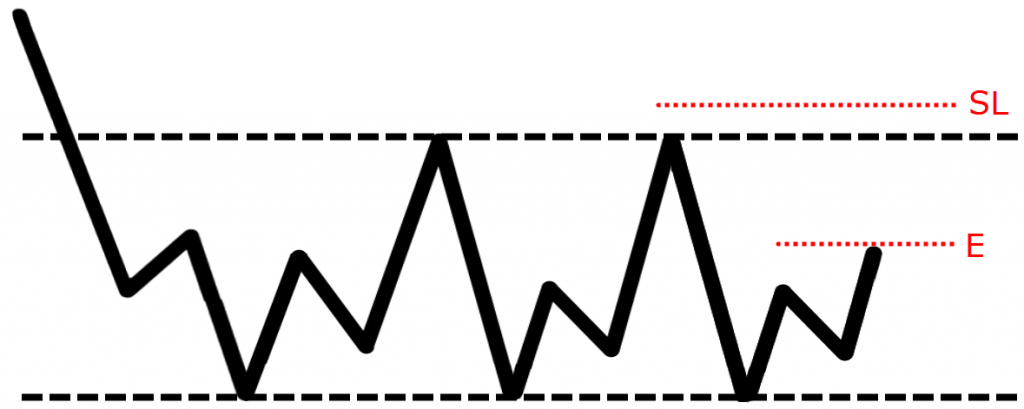
Why is that?
Because the textbooks tell you that if you put your stop loss above the highs, and if price trades into the highs taken off your trade, it is telling you that price is breaking out.
Then, your trade is invalidated, and you should get out the trade.
But, recall the earlier example where I talked about overshoot.
Support and resistance can overshoot on your charts.
Meaning, they can just simply trade higher, and then come back lower: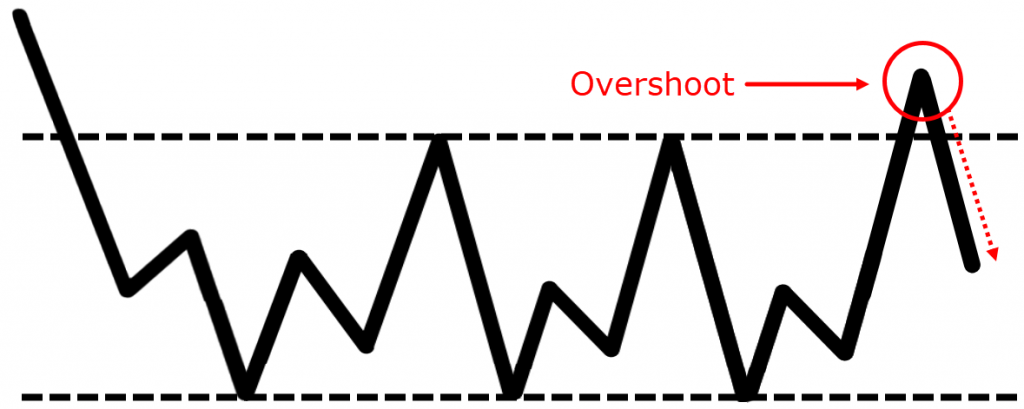
And if you were to place your stop loss just above the highs.
Wouldn’t you be subjected to be stopped out unnecessarily?
Does this make sense?
Similarly, if you were to go long at support, and again, the textbook, or the courses you attended, they tell you to put your stop loss below the lows of support.
Because the price has not reached beyond the lows of the support you’ve identified.
And if the price reaches beyond the lows is telling you that the support is breaking, and you should be out of the trade.
But again, think about this, earlier I shared with you.
Support and resistance, they can overshoot like this: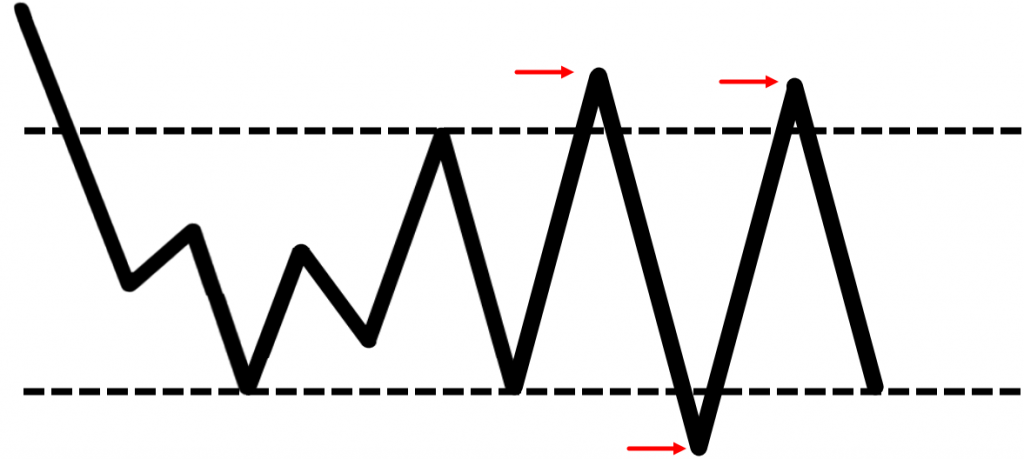
So, if you were to put your stop loss just below this low, what’s going to happen is that you will get stopped out unnecessarily, and watch price goes back in your favor!
What is my point?
My point is very simple…
Don’t place your stop-loss just below support, or above resistance.
Because of the fact that I shared with you.
That support and resistance can undershoot or overshoot.
Meaning that they may not come close to the support area you have identified.
Or it may even exceed the support area you have identified, and then trade back in your intended direction.
Are you with me?
Moving on…
Stop hunts
Let me share with you a few examples of what I mean by overshoot:
You can see a support area.
Then you notice the price just trades lower, and then it trades higher from there!
Picking on those who place their stop loss below these lows over here:
Another example:
This is the chart of crude oil.
You see that price rallied higher, came back lower, triggering the stop loss on the lows and then trade higher once more!
This phenomenon is common.
You can look at your charts, and see for yourself.
Use this information I shared with you.
Go, and verify whether it makes sense to you.
Because all these I’m sharing with you is based on my experience.
I could be wrong, but still, I’m just sharing based on my experience.
So, it’s best that you go look at the chart, and see whether Rayner makes sense or is he just talking nonsense.
Let’s do a recap…
Recap
- Support, and resistance is an area on the chart. It’s not a line on the chart. Because, there is a possibility of price undershoot, and overshoot.
- The more times support, and resistance gets tested, the weaker it becomes. Because the order in the markets gets filled and the barrier will break.
- You should not place a stop-loss just below the lows, and highs in the market. Basically, don’t place your stop-loss just below the low support, above the higher resistance.