Supported resistance is one of the most popular concepts in technical analysis and there’s a lot of conflicting information out there about support and resistance.
That’s why I’ve created this lesson to share with you the cheat sheet with the most important concepts about support and resistance.
Once you’ve gone through this lesson, you’re pretty much ahead of 95% of traders out there.
Here’s what you’ll learn today:
- How to tell when support resistance will break (so you don’t get caught on the wrong side of the move)
- Why not all support resistance areas are created equal and how to identify the best ones that offer the greatest profit potential
- How to find losing traders to push the price in your favour so you can take profits while they cut their losses
- Support and resistance: How to find profitable trading opportunities overlooked by 90% of the traders
Without further ado, let’s kick things off.
How to tell when support resistance will break When you see a series of higher lows into resistance, you want to avoid selling at resistance.
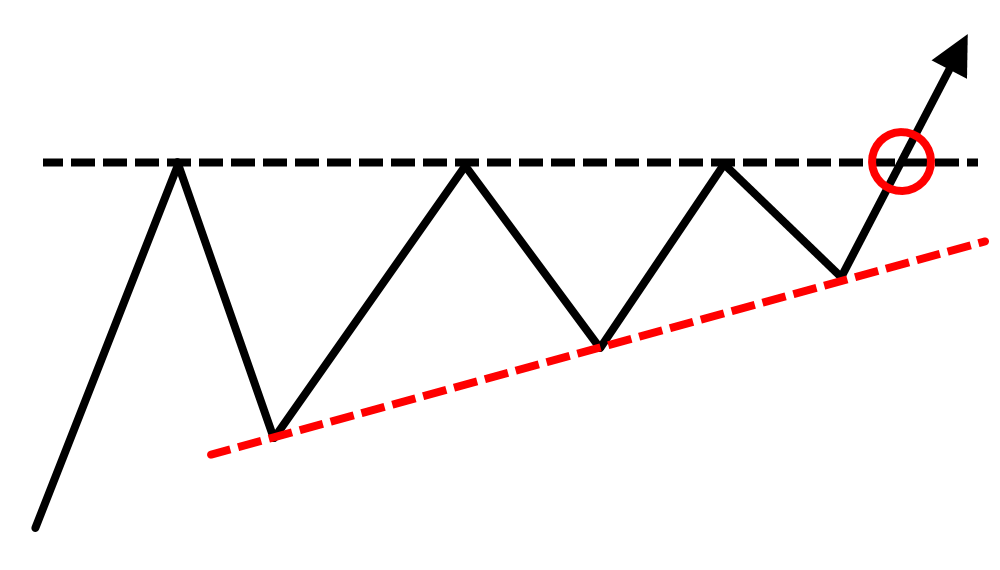
The reason is simple. Let me give you an analogy. Let’s say in your hands now, you have this huge sledgehammer which is huge and strong. Right in front of you is a wooden door.
You take the sledgehammer and you smash against the door many times, over the next few minutes. Let me ask you, is the wooden door likely to hold or is it likely to break?
Well, common sense would tell you that the door is likely to break. And this concept is the same as what I’ve just shared with you.
When resistance is tested multiple times within a short period, chances are that area of resistance will break. It’s not 100% going to break, there’s no 100% in trading, but the odds of the resistance breaking is high.
And likewise, when you see a series of lower highs into support, chances are that the support is going to break.
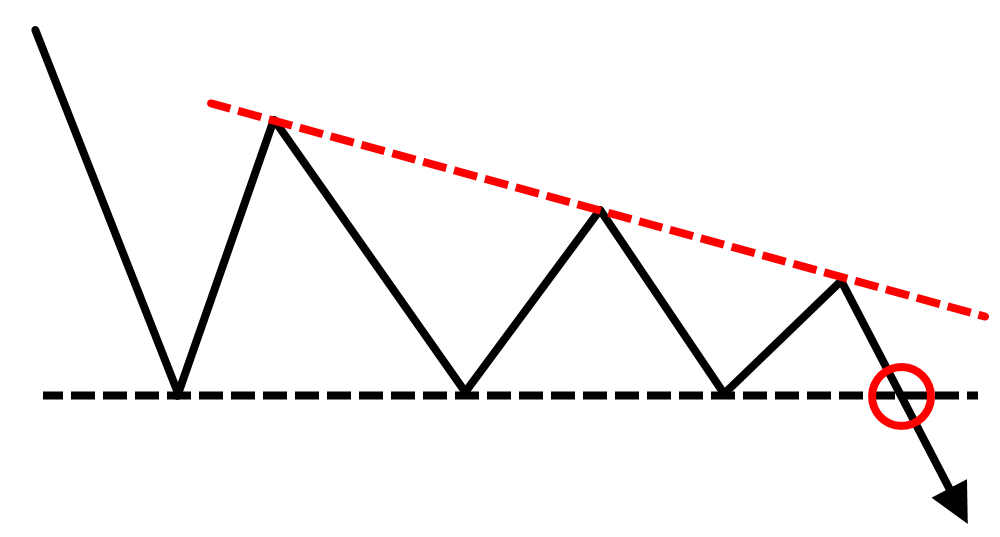
That’s like a sledgehammer smashing against the door multiple times, chances are it’s going to break.
Let me share with you a few examples so that you can understand where I’m coming from.
Example #1 in EUR/AUD:
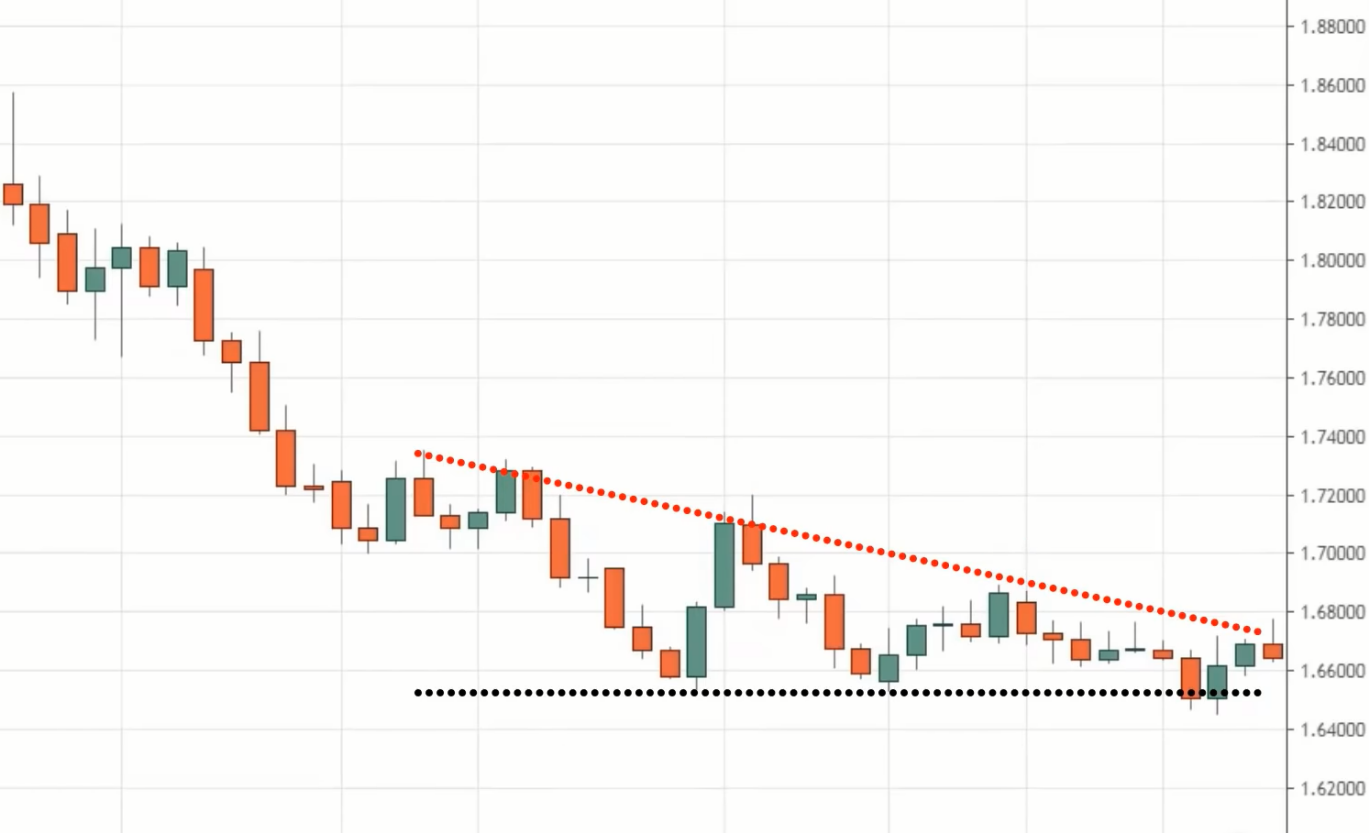
You have a series of lower highs coming into support. You don’t want to be buying at this area of support, because chances are, the price will break down.
Example #2 in Bitcoin:
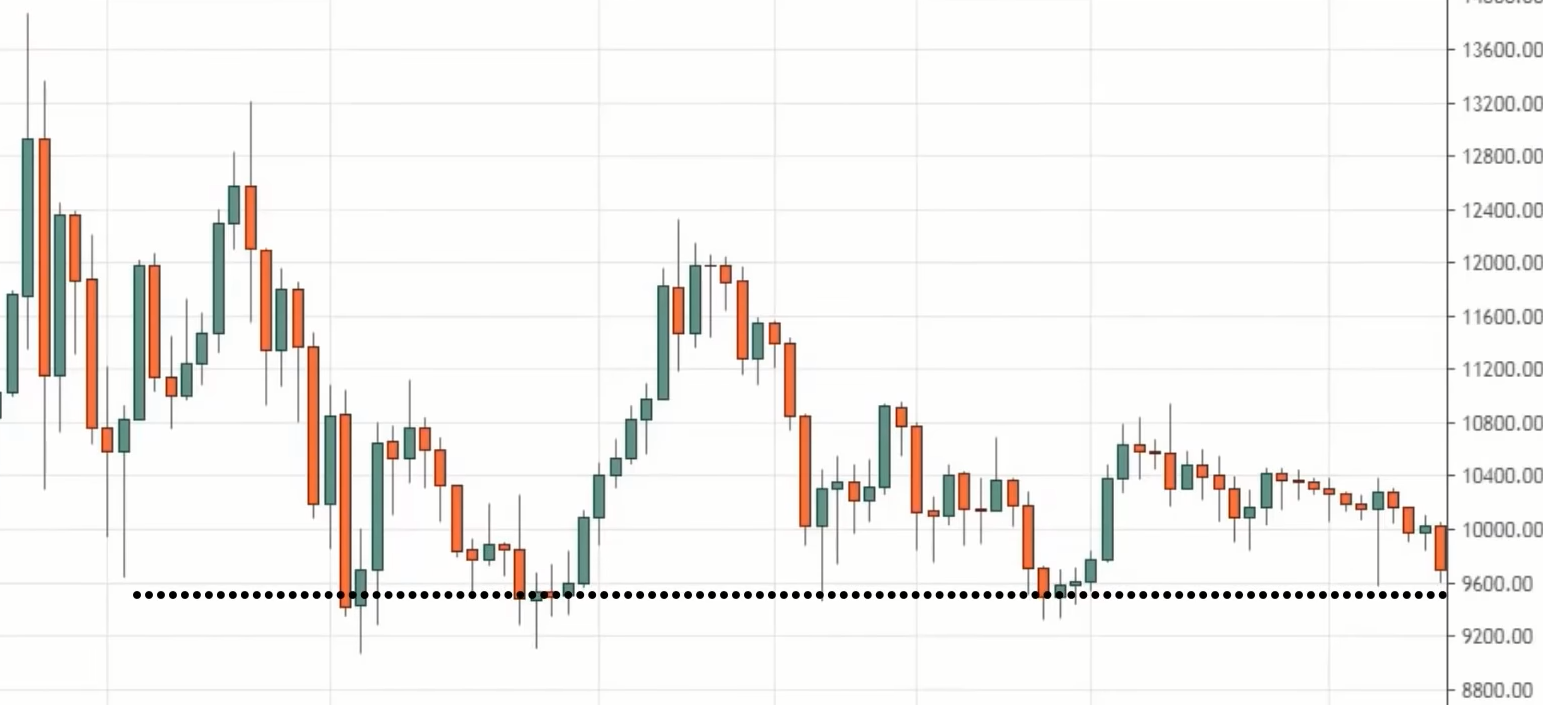
Bitcoin was a market that traders were fascinated in the 2017, 2018 period. Look at that.
You see a series of lower highs into support over there. Do you want to be buying at that area of support? I hope not.
Because chances are, that area of support will breakdown because this is a sign that sellers are in control. They have managed to push the price lower with each subsequent push.
Example #3 in Bitcoin again:
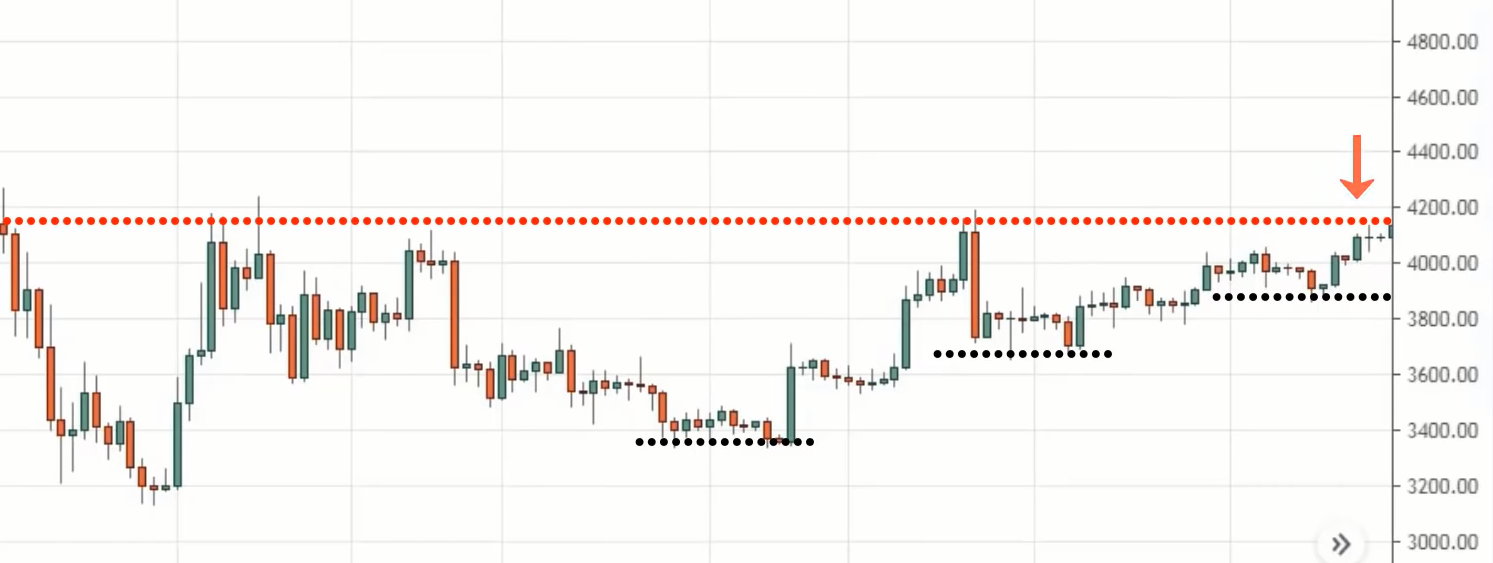
Look at the higher lows into resistance, do you want to be selling at this area of resistance? I hope not because this is a sign that the buyers are in control.
This is where the sledgehammer has smashed the door multiple times and you want to avoid shorting at this area of resistance.
Hopefully, you understand the concepts here that I’m sharing. where I’m coming from.
How to find the best support resistance areas to trade
The key thing you want to find is a strong power move into support resistance. Now, what do I mean by power move?
A power move is simply a strong momentum into an area, let’s say for resistance, you want to see a strong, big bullish candle coming into resistance.
I know this sounds counter-intuitive:
“Why do you want to sell when there’s such strong bullish momentum into resistance?”
“Why do you want to buy when there’s such strong bearish momentum into support Rayner?”
I get it and I’ll explain to you shortly.
The reason is because, when you get a strong power move into an area, the first obstacle is usually far away.
And when the first obstacle is usually far away, it means you get a greater profit potential on your trade. Let me explain.
Example #1 USD/SGD:
If you look at this USD/SGD, pay attention to how the price approached the resistance (black line).
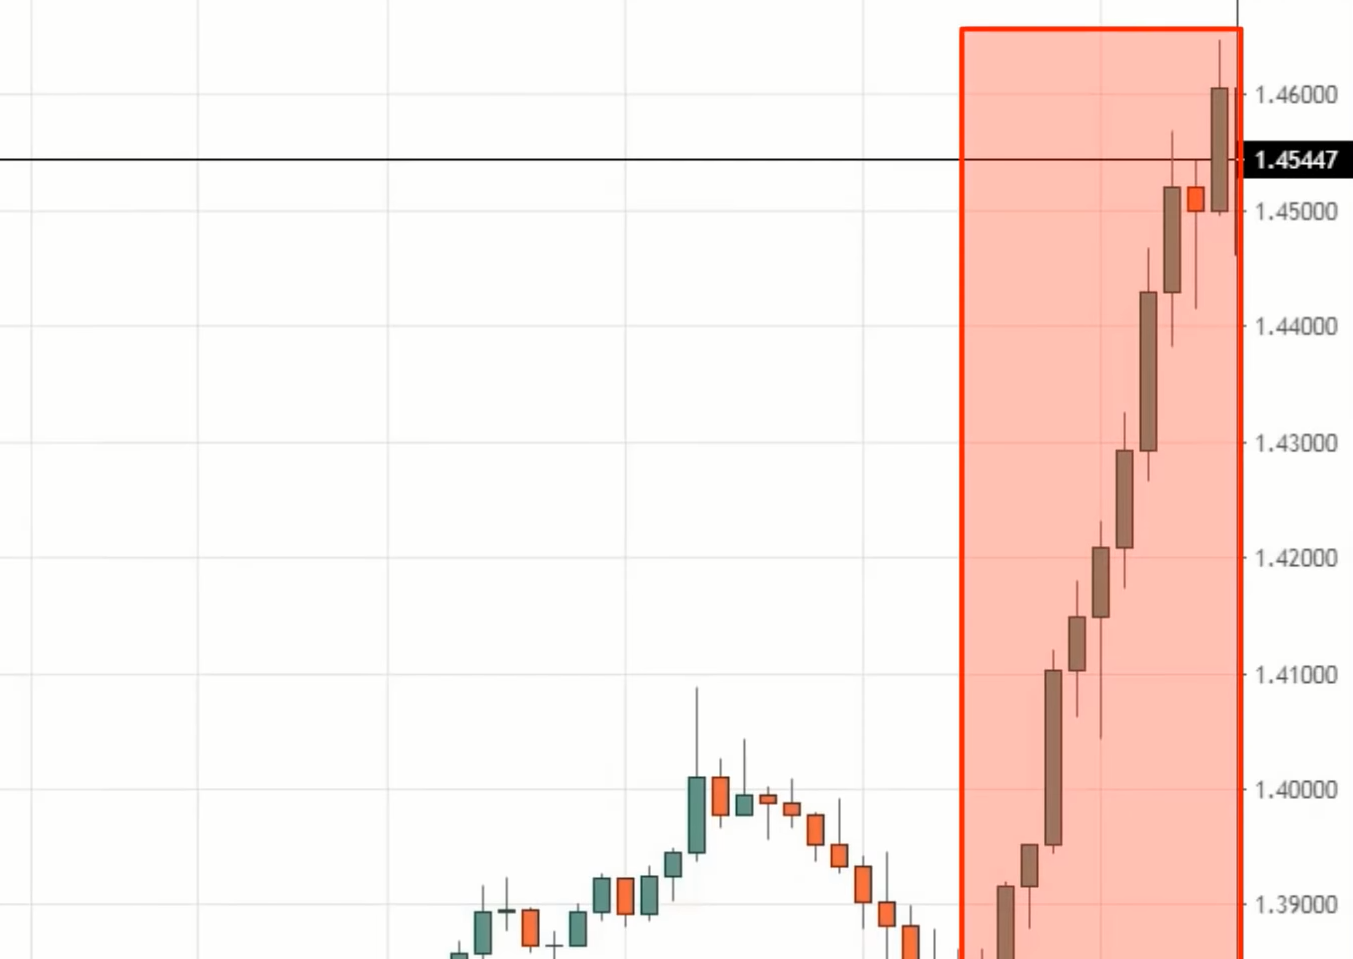
Pay attention to this section over here, what do you see?
You see strong bullish momentum into that area, that’s correct.
And at this point, many traders are thinking, “Rayner, the market is so bullish it’s time to buy, buy, buy!”
And when they buy, it’s a disaster. But that’s beside the point. Why do I want to see a strong power move into resistance?
Because when you have a strong power move into resistance, I mentioned earlier that your first obstacle level is usually far away.
What do I mean by first obstacle level? Let’s say you short at that resistance, at which point on your chart will buying pressure come in?
Well, if you ask me the first obstacle that the sellers would face, would probably be this area over here where this previous swing high turned support, around the $1.41 area.
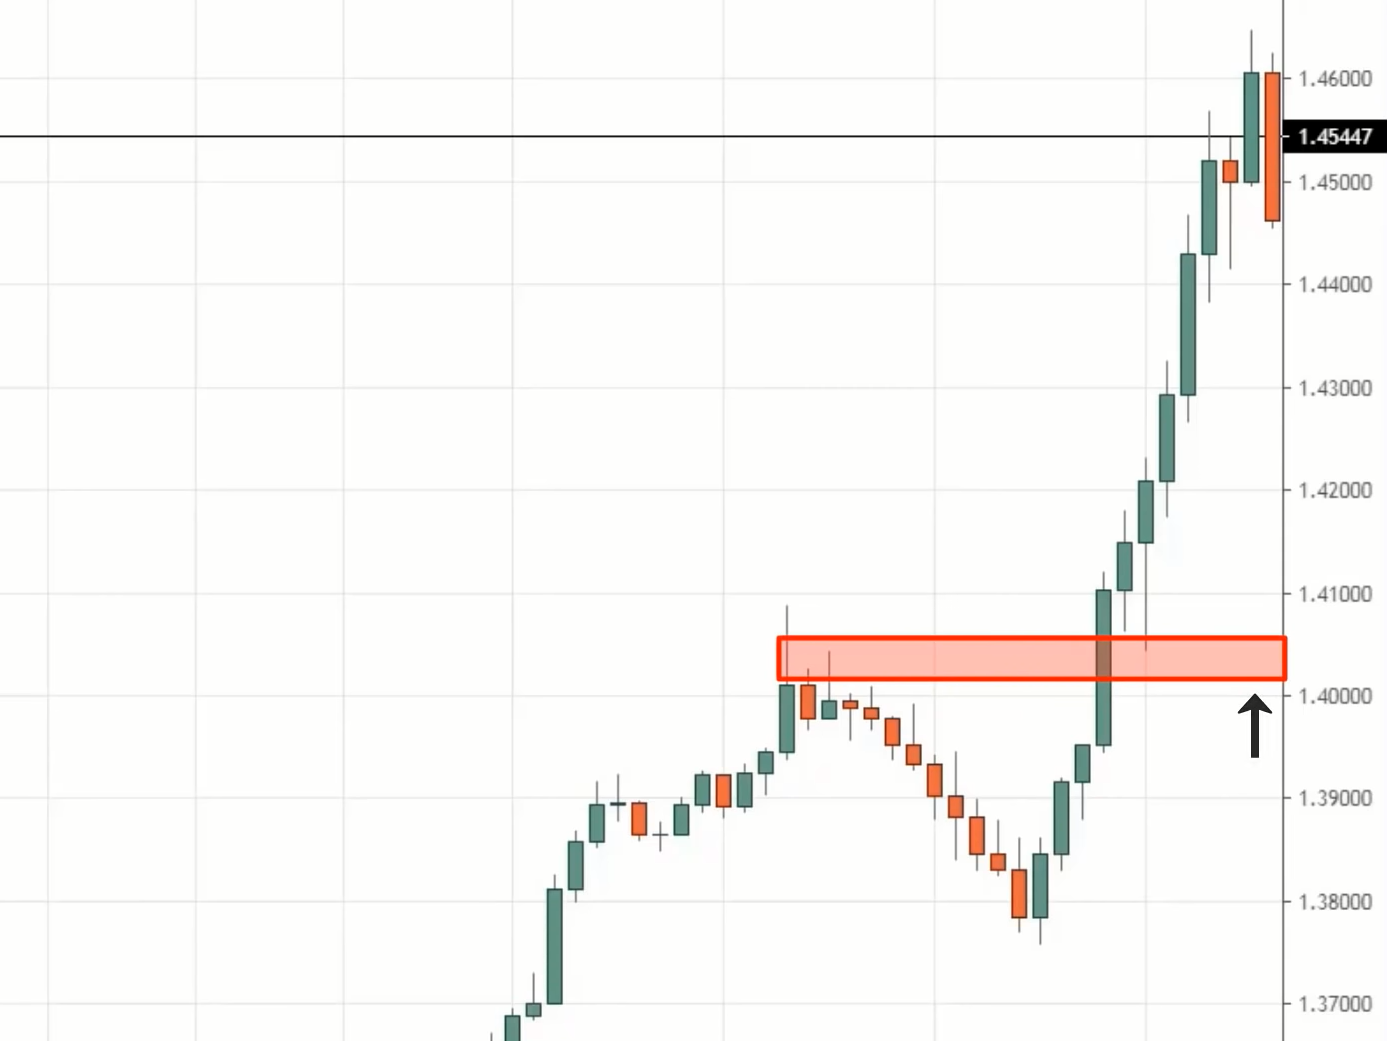
So you can see that your profit target is pretty decent. If you went short at that resistance area, your profit potential is all the way down to the $1.41 level, which is quite a large distance compared to when you don’t have a strong power move into a level.
Let’s say you have a choppy move, like higher lows into resistance, your profit potential will dramatically be reduced.
Example #2 Bitcoin:
Let’s go back to the earlier example of Bitcoin, where you see a series of higher lows into resistance. Now let’s imagine that there’s a bearish candle at the right side.
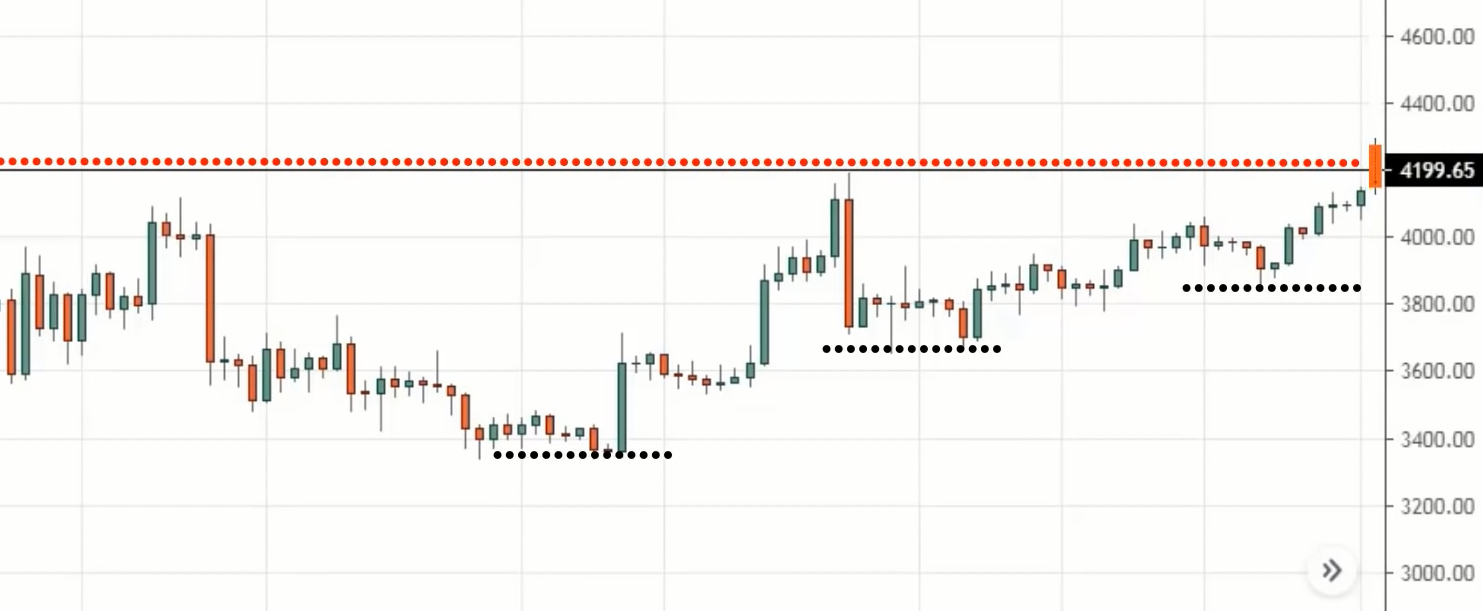
At this point, if you were to be selling, then your nearest obstacle will be the nearest swing low (black dotted line).
Or if you’re connecting the lows using trendlines, then your first obstacle might even be over here:
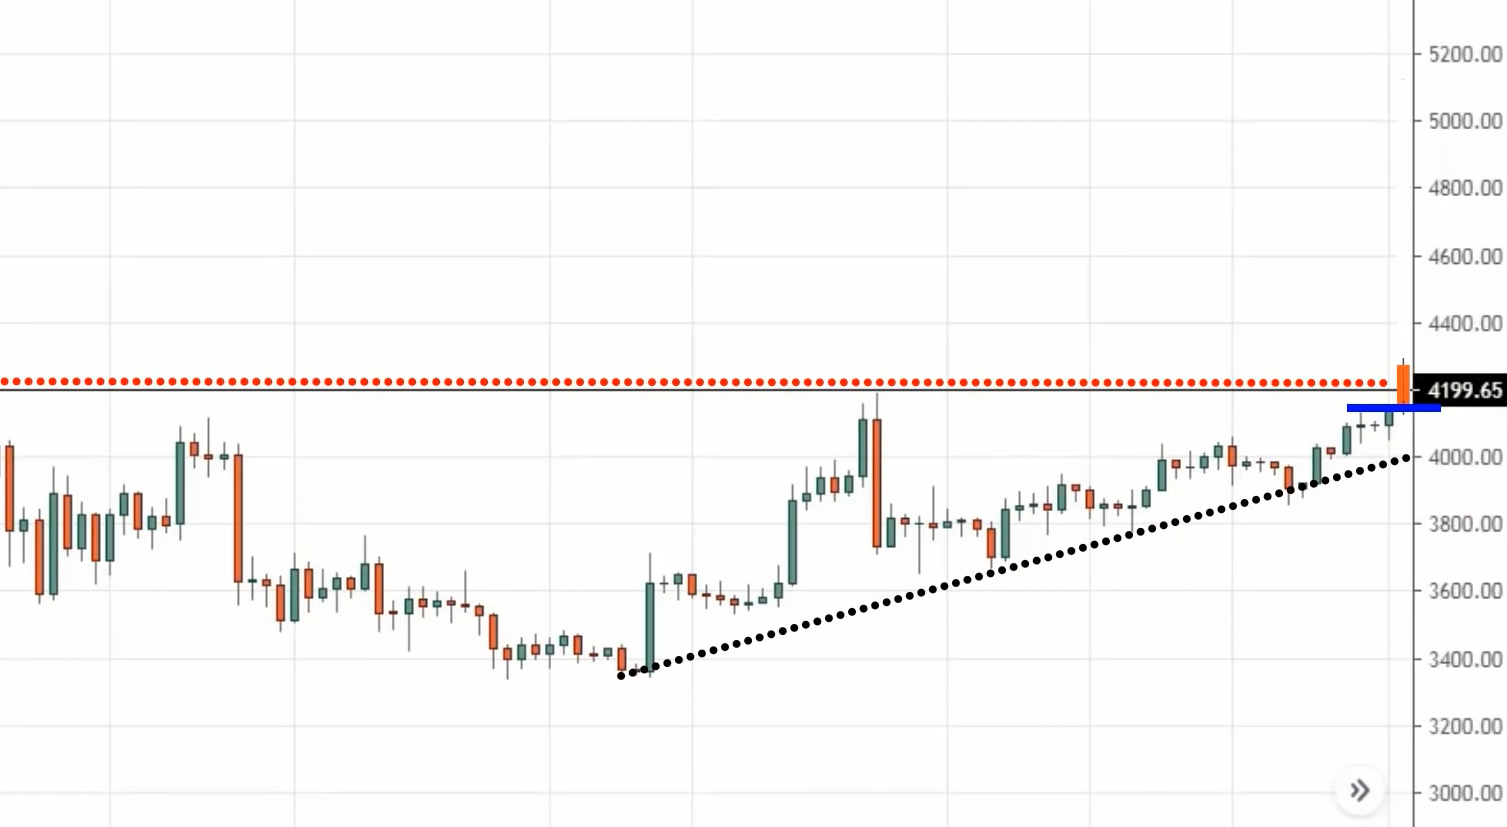
You can see that there’s not much profit potential, because of this choppy price action coming into resistance.
That’s why you want to trade support resistance when there’s a strong power move into that area. This is where your profit potential is the greatest as your first obstacle is usually far away.
Example #3 USD/MXN:
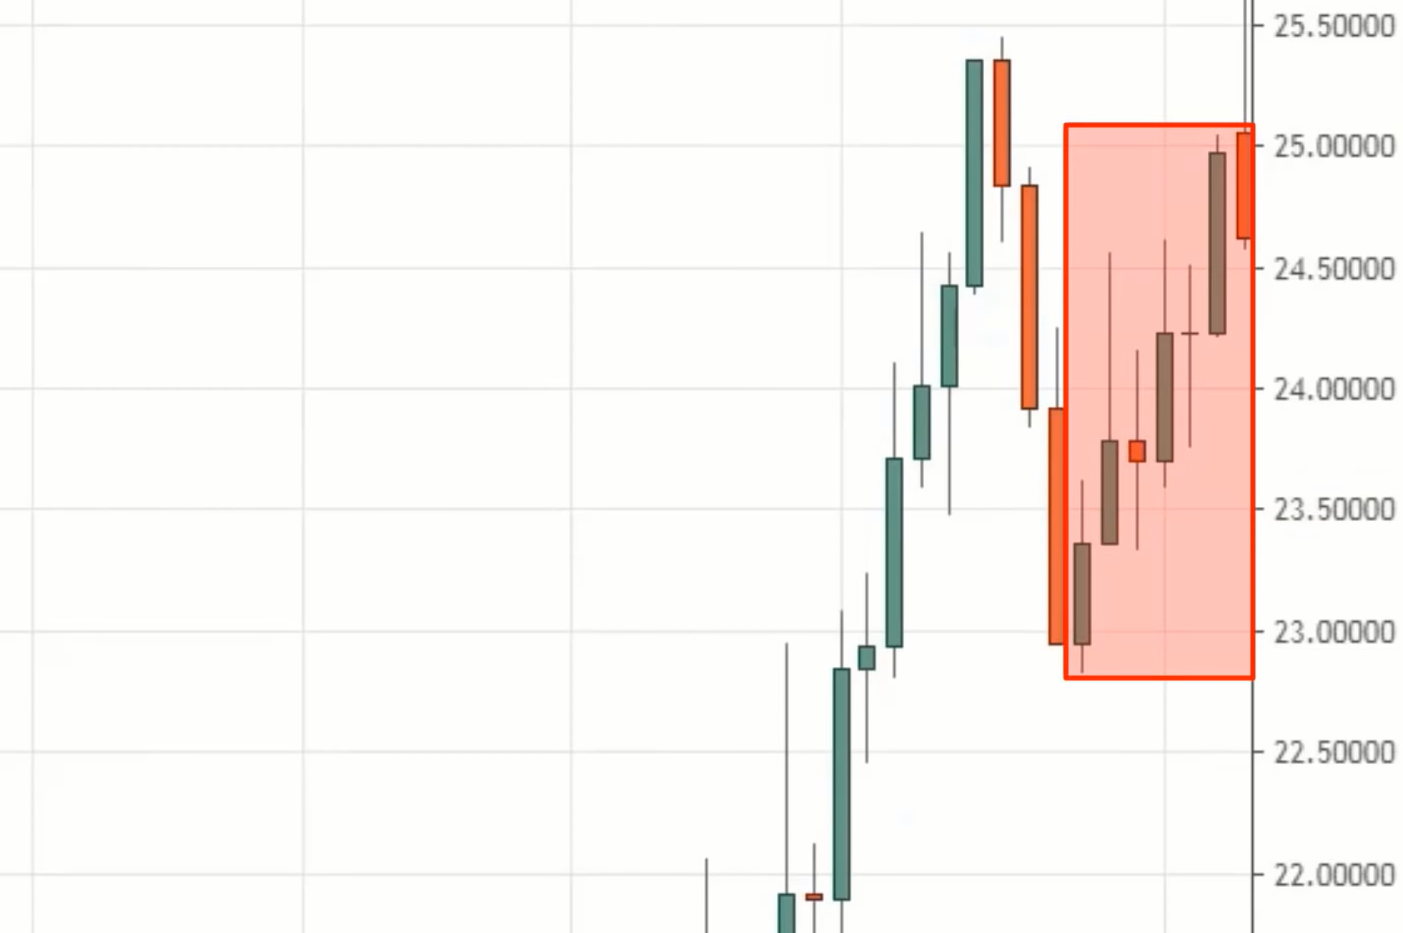
You can see a pretty nice power move coming into the previous swing high. So ask yourself where is the first obstacle on this chart?
Well, buyers would probably come in to buy near this swing low:
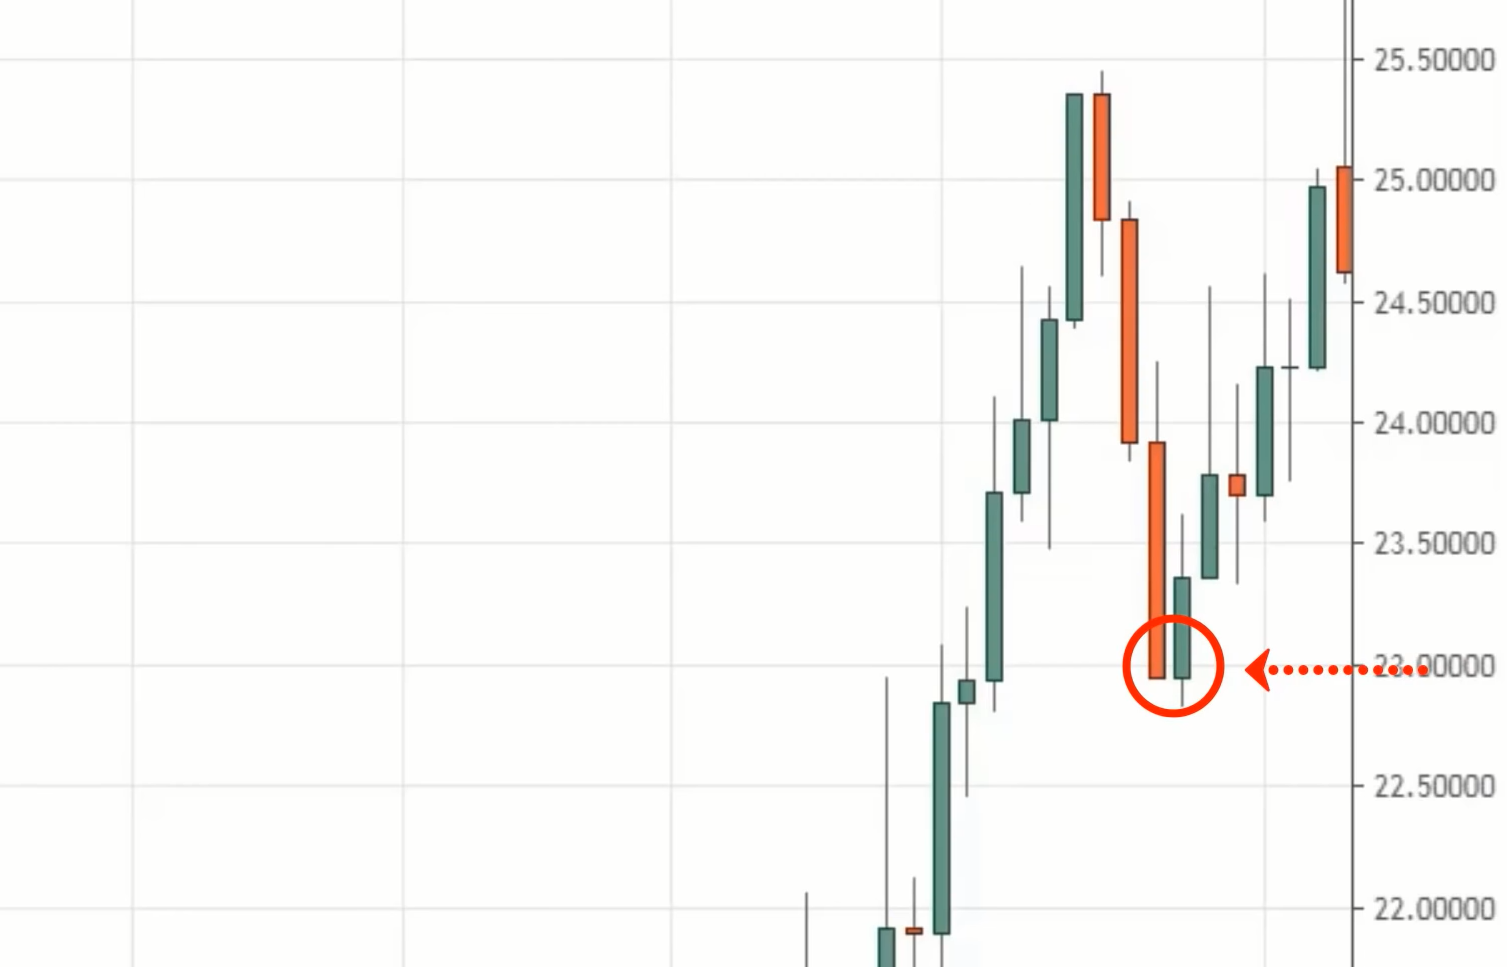
So you can see that the profit potential is much better compared to the price action where price forms a series of higher lows into resistance.
Example #4 GBP/CAD:
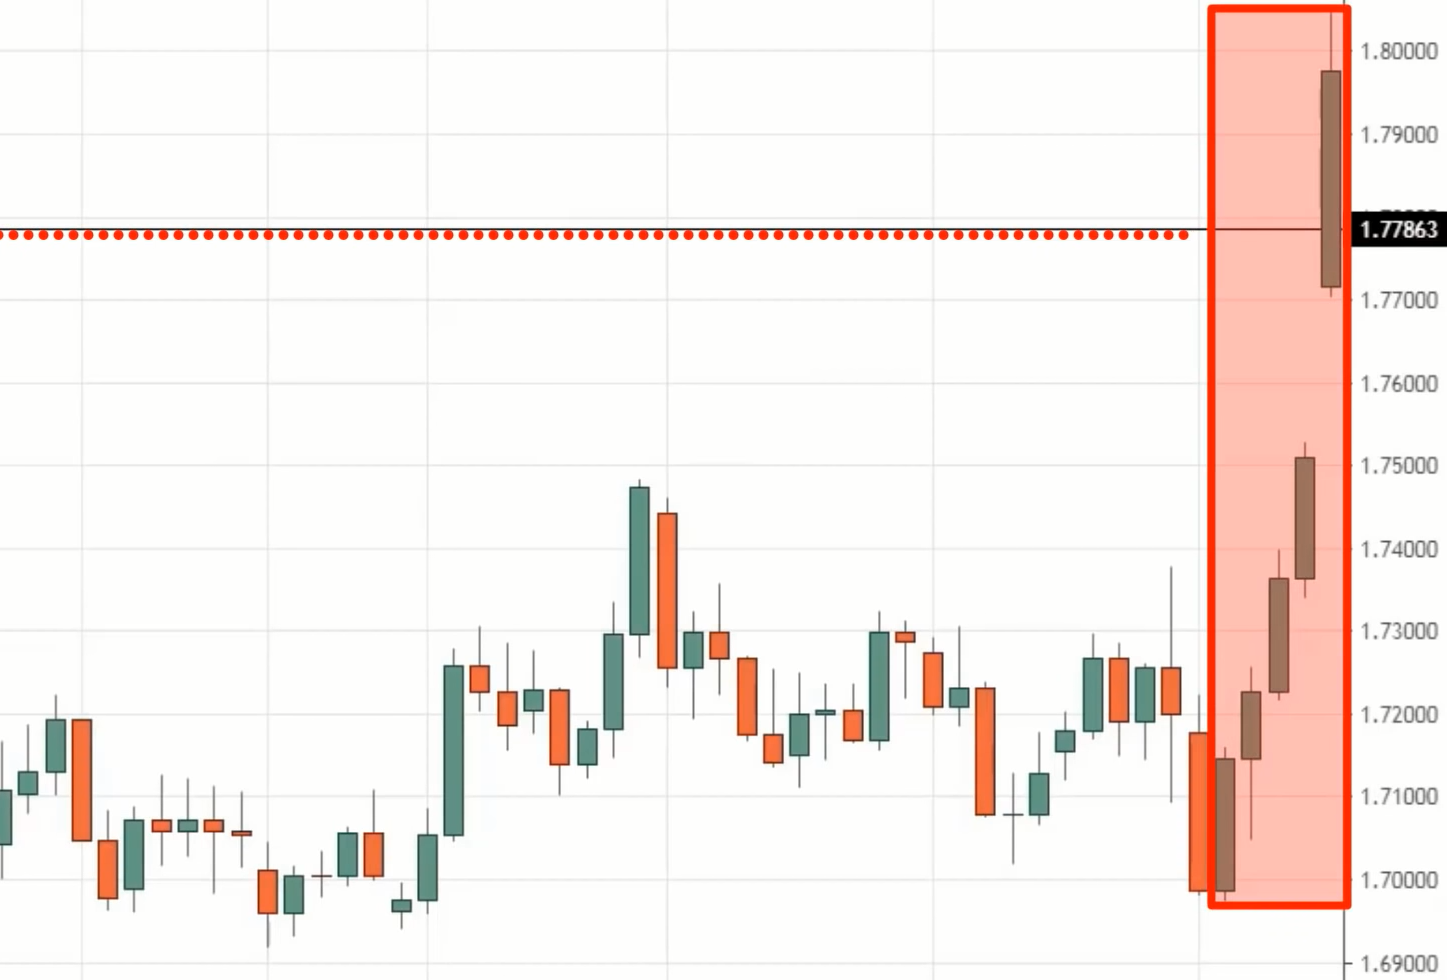
You see a nice strong power move here into this swing high.
The first obstacle where buying pressure could come in could be at this previous resistance turned support:
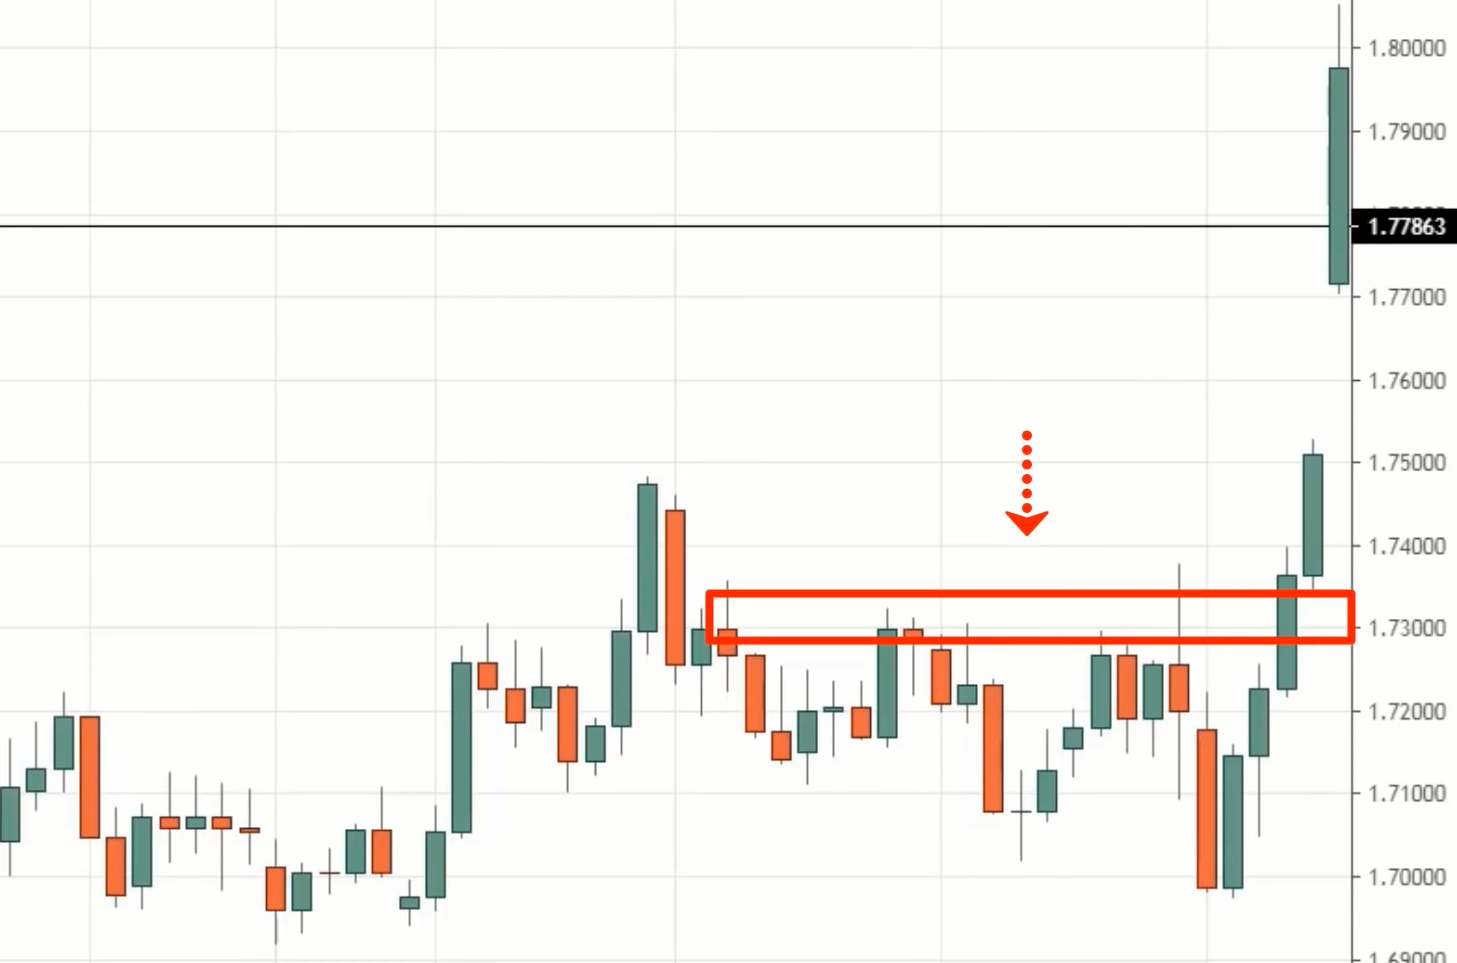
So if you went short at resistance, your profit potential could be from there all the way down to that first obstacle. There’s a distance for the market to move, which results in a more favourable risk-to-reward on your trade.
I hope that makes sense. This is how you find the best support resistance areas to trade – you want to see a power move into support resistance.
Avoid trading very choppy stair-stepping moves into support resistance because that’s where those levels usually breakdown.
How to find losing traders to push the price in your favour (so you can take profit while they get stopped out)
Where do you find this group of losing traders?
The secret is this…
Let’s say you want to sell at resistance, you’ll want the price to take out the extreme levels, like the highs of resistance so that you can profit from trapped breakout traders.
I’ll explain how this works.
Example #1:
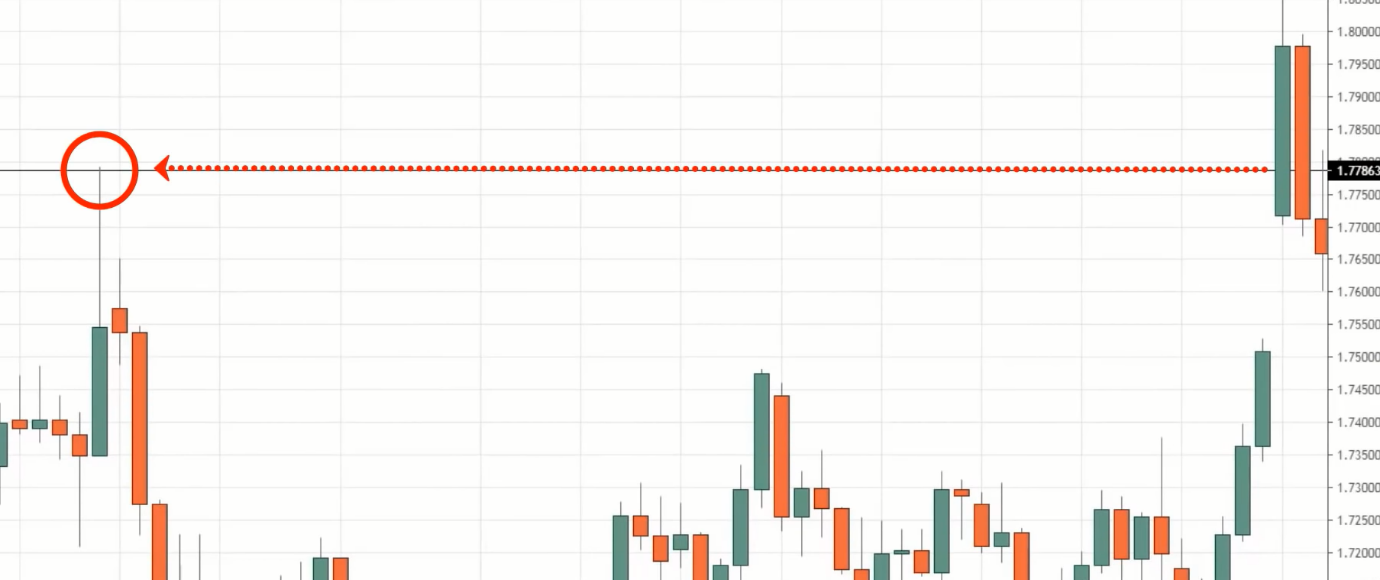
You can see that this market has taken out the extreme high of resistance. Why is this significant?
Because there will be a group of traders who are thinking, “The price has broken out of the extreme high, it’s bullish and it’s time to buy!”
And when you buy the breakout, where will you set your stop loss at? It will likely be below the lows of the candle which broke out.
Some traders might even be more conservative and place their stop loss much lower, below the area of support.
What’s happening now is that let’s say the market didn’t break out and instead it reverses lower, it will trigger these clusters of stop losses placed below the breakout.
In other words, when the breakout traders lose, they’ll have their stop losses hit, and that’s where the reversal trader like you who sold at resistance can profit from this group of breakout traders.
That’s why I mentioned that you want the price to take out the extreme levels because when it breaks out of the extreme highs or breaks down from the extreme lows, that will entice more traders to enter the trade.
That will be when we take advantage of these group of traders.
Let me share with you another example.
Example #2 S&P 500 E-mini futures on weekly timeframe:
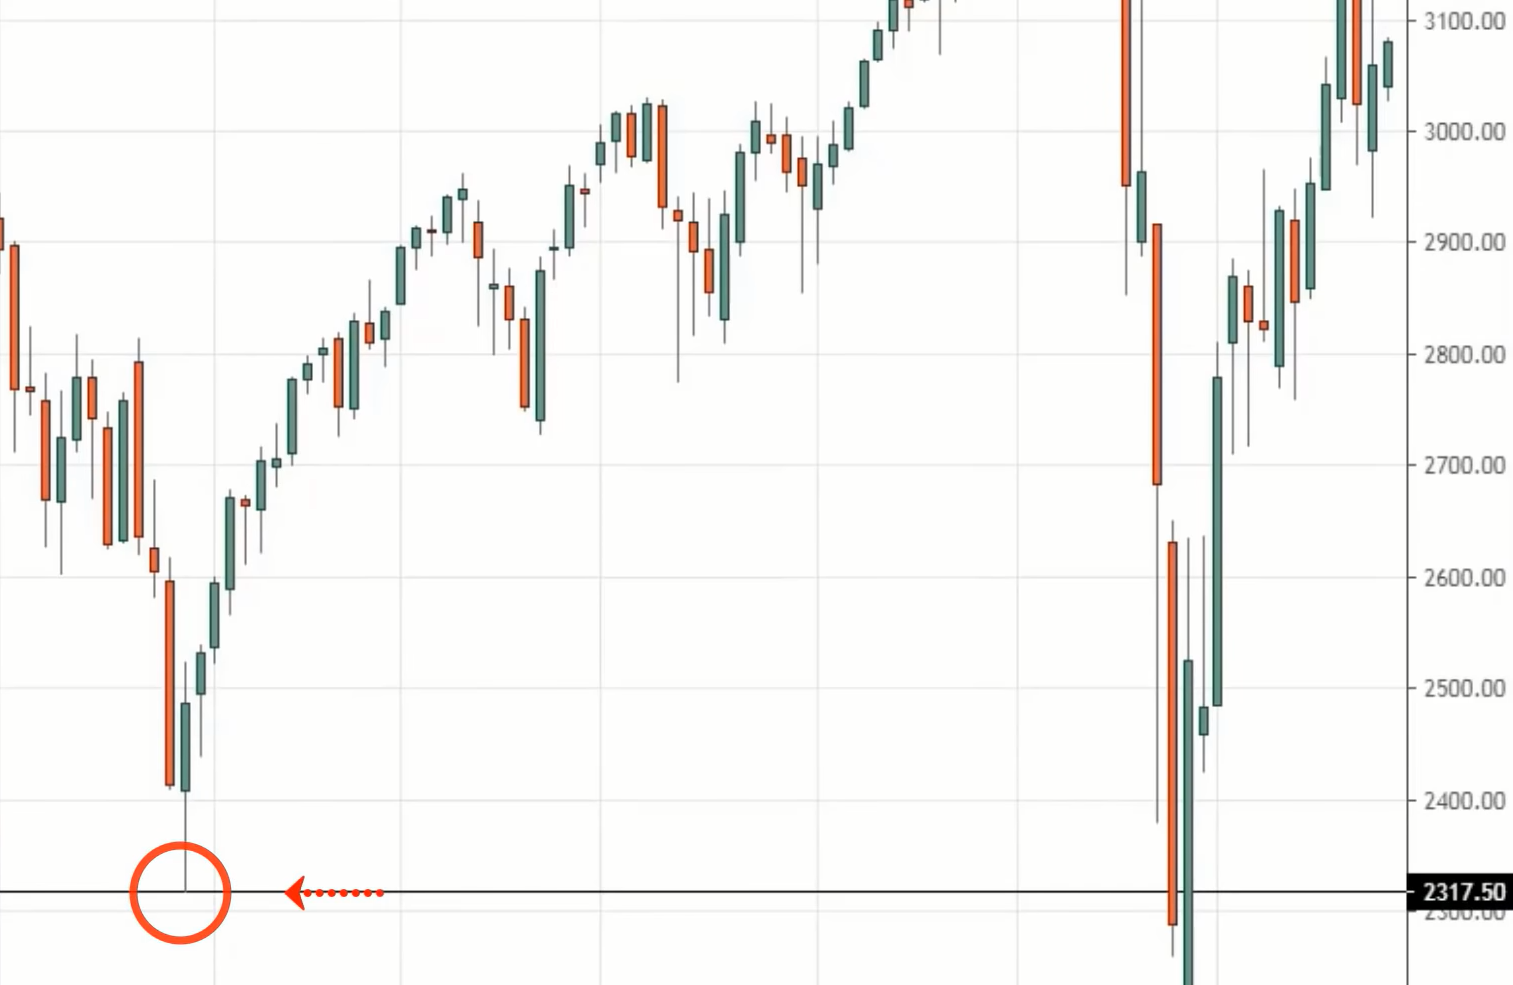
This is an important level because it’s an extreme low, and many traders are thinking to go short if the price were to break below that level.
And yes, the price broke and even closed below that level. Then guess what? Price took out the extreme lows, but on the next week, it reverses higher near the highs of the previous week.
This is what we call a false break setup. And again, this is bullish.
Because for traders who are short on the lows, will likely have their stop loss anywhere above the highs of the bearish candle which closed below support.
Now, if the market rallies, it will hit this cluster of stop loss and fuel more buying pressure to push the market in your favour.
Because when traders go short, their stop losses are buy stop orders to get out of their short trade.
So if the price hits those stop losses, it will create more buying pressure. Make sense?
So that’s the third concept that I want to share with you, that is – how to you find losing traders to push the price in your favour.
And finally…
How to find support resistance trading opportunities that most traders overlook
It’s very simple.
If your entry is on a daily timeframe, then go up to a higher timeframe like the weekly timeframe, and look for a buildup, or otherwise known as a tight consolidation.
Because when the higher timeframe is forming a tight consolidation, chances are you will be able to find support resistance trading opportunities on the lower timeframe, like the daily timeframe.
Or, if you spot a tight consolidation on the daily timeframe, then on the 4-hour timeframe, you should be able to find support and resistance trading opportunities.
Example #1 NZD/CAD:
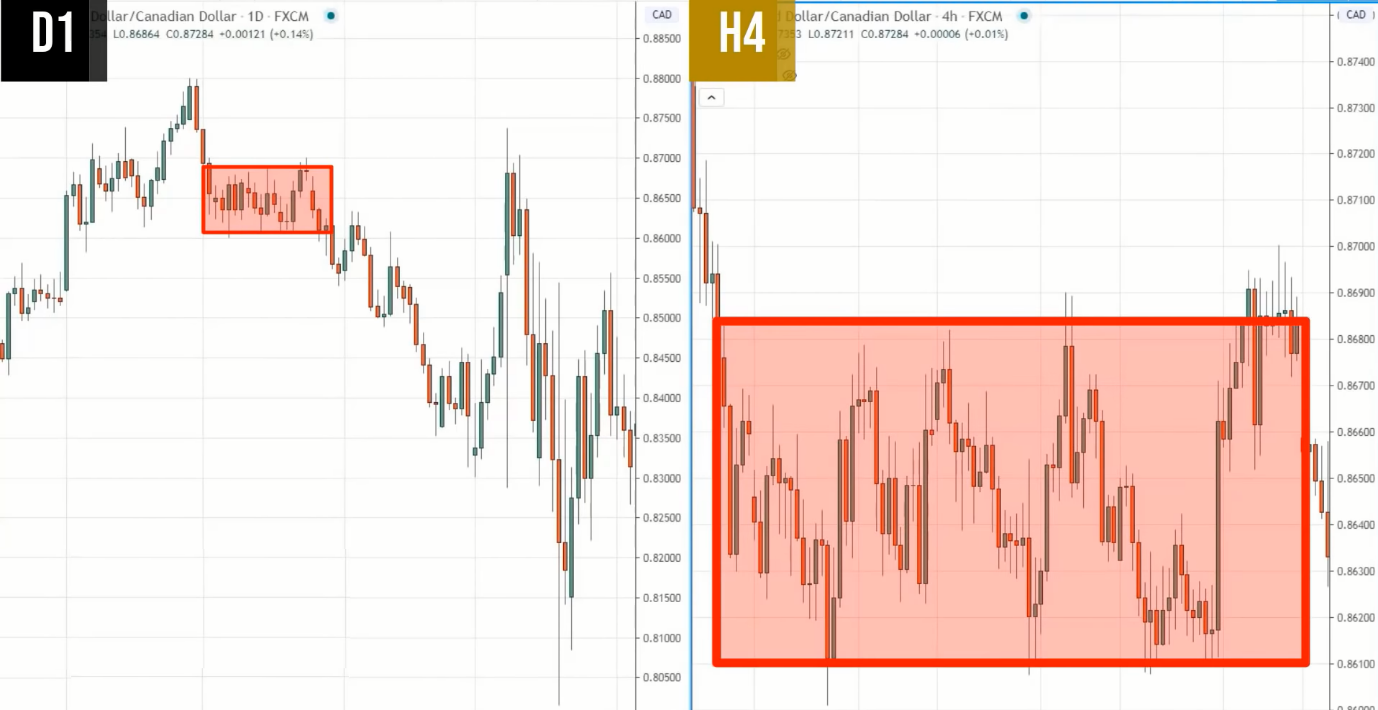
For the consolidation that you see on the daily timeframe, you can identify the support and resistance better on the lower timeframe, the 4-hour chart.
Now you have a more visible support resistance to trade form, you can now buy low and sell high.
This is a technique that you can use to find support and resistance trading opportunities.
With that said, let’s do a quick recap…
Recap
- Avoid buying lower highs into support or shorting higher lows into resistance
- If you want to trade reversals, look for a power move into support resistance
- Let the price take out the extreme levels so you can profit from “trapped” breakout traders
- Buildup on higher timeframe = opportunities on lower timeframe
With that said, I wish you good luck and good trading. I’ll talk to you soon.
